

Performance and productivity metrics are important because they give us the needed information to shape or reshape behavior. They provide the feedback and insight to continually improve processes and practices toward our common goal, namely creating value for the customer.

Unfortunately in many large IT shops, performance metrics are not aligned toward this common goal and rather reflect the objectives and scorecards of single departments or practices. For example, does a customer care about Uptime? No. Customers/users expect applications and the systems they run on to be up. They don’t care if it has been running for 1 day or 364 days without interruption. Yet uptime (aka the five 9’s) is often a key success metric for System Administrators and IT shops at-large.
Nice work keeping the servers running,” said no CEO ever.
Too often, we focus on IT-centric measures, like uptime, rather than on customer or user success measures to evaluate our performance. I am not suggesting uptime is not important rather if you approach this metric from the customer point-of-view, you will quickly see the measure of uptime is not really valuable to the customer nor does it provide any real value to the organization regarding performance.
To keep it simple, think of your car or truck. When you bring it to a garage would you want the mechanic or service manager to tell you how many days, hours, and minutes you drove it without incident before bringing it into the shop? No. You don’t care. Would that data be valuable to the car dealership or manufacturer? Does it provide actionable data? I would argue no.
But in IT, we think Uptime is a critical, key measure. We bonus people on maintaining uptime levels. We spend time and money capturing, collecting, transforming, and reporting on that data. Yet, it isn’t adding value to either our customer or our own performance.
Borrowing a page from DevOps, we know that flow-based, event-driven metrics are critical to measuring and reporting on the performance of teams developing and deploying applications and infrastructures. Flow-based, event-driven metrics help IT teams answer critical performance questions from the customer perspective. They provide feedback on value creation processes and practices like:
- How quickly can a request be fulfilled?
- How quickly can a new or updated capability, function, or service be delivered?
- How quickly can the system recover from and an issue or outage?
- How likely is a customer to fail taking an update from you?
These customer-centric questions easily translate into performance measures such as success rate, change cycle time, mean-time-to-recover (MTTR), and release frequency. Additionally, all four of these metrics are directly actionable.
For example, if your Uptime metric is missed you then need to generate a new report highlighting downtime. More specifically, you need to inspect downtime to understand why it happened (success rate): why it took so long to recover (MTTR); and, why it took so long to repair (change cycle time).
It is these event-based metrics that provide the insights and data to improve performance. If success rate is low, you can evaluate your quality, verification, and validation processes to understand how and why issues are missed before hitting Production. If your recovery time is too long, you can evaluate the processes of deployment, rollback, and failover to improve adherence to known-good packages and standards. If cycle time is too long, you can evaluate your change management and development processes to accelerate responsiveness and agility.
Furthermore, if you do measure these flow-based, event-driven metrics you will be indirectly managing uptime. If your success rate is high and your recovery time is low, then by default your uptime is high.
And don’t forget the customer, these flow-based, event-driven metrics also correlate to customer satisfaction and value. If IT is responsive to customer requests, timely in its delivery, confident in quality, and quick to recover if an issue does occur, then customers will be more satisfied with the services provided. This is corroborated by the annual State of DevOps Report that regularly suggests high performing IT teams are twice as likely to over-achieve on enterprise profitability, market share, and productivity goals.
So, where does this data come from?
Flow-based, event-driven performance metrics are derived from data generated by continuous delivery (CD) pipelines. Event and application data combined with logs from various tools along the workflow capture key measures that reflect real-time pipeline performance.
For example, an automated test tool, like unittest, will generate a success flag, audit trail, as well as an elapsed time count. This data combined with data from other applications across the tool chain is aggregated by a change or release candidate. Together this data illustrates the success rate and cycle time of the end-to-end process for a single change or release candidate. Change/release data can be further combined to illustrate trends at the application, program, portfolio, or enterprise level.
Granular, real-time data surfaced to teams provides them with the needed information to act. This data can inform a team early that there is a problem with a given release, or that their process is too slow. Furthermore, it points directly to the constraint area or issue allowing the team to quickly swarm the problem.
Employing this proactive measurement model requires a shift in how we design, build, and report metrics from both a technological and business perspective. It requires a clear understanding of desired enterprise outcomes, collaboration across IT and business functions, and modern architectures to be successful. For a deep dive on how to build proactive monitoring systems, I recommend the book The Art of Monitoring by James Turnbull.
Summary
Our experience in helping customers transform IT using DevOps principles and practices has hardened our resolve to the importance flow-based, event-driven performance metrics. Without these metrics it is impossible to prove success with DevOps and more so impossible to understand where to best act next. Metrics are the language of the executive.
If we want to transform the enterprise we need to use a language they understand. IMO, flow-based, event-driven performance metrics are the key.
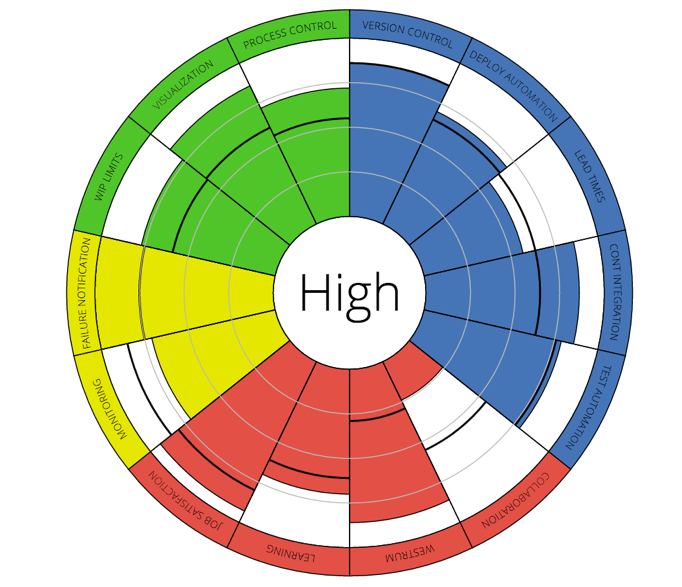
 Recently, I have been working with the thought-leaders at DevOps Research and Assessment (DORA). They have incorporated these customer-focused performance metric into an online assessment tool, also called DORA. The tool not only maps these metrics but also identifies 20 known IT capabilities proven to drive enterprise performance. Check out the assessment and please note that measurement and monitoring are considered a key competency there too.
Watch DORA CEO and Chief Scientist Dr. Nicole Forsgren and CTO Jez Humble’s research program presentation, “What We Learned from Three Years of Sciencing the Crap out of DevOps.”
Sources:
Figure 1: The DevOps Scorecard
Figure 2: DevOps Research & Assessment
